Thursday 26 November 2015

Variation in the Climate Change Signal of the Discharge for the River Mitano Part 3: Hydrological Model, Downscaling and Lack of Data as Sources of Uncertainty

Uncertainty in hydrological model structure and calibration, and parameterisation uncertainty

Uncertainty in the hydrological model can result during its calibration. For example, Kingston and Taylor (2010) experienced occasionally very poor month-to-month performance of the model, with substantial monthly flow events either missing or erroneously introduced in the modelled time series. They attributed this to discrepancies between the observed (station-based) precipitation data within the Mitano Basin and the CRU TS 3.0 data set used for calibration of hydrological model – in other words, the gridded rainfall data over the Mitano Basin that the model was run with was of dubious accuracy (Kingston and Taylor, 2010). This poor month-to-month performance remained following autocalibration routines and manual calibration of the most sensitive parameters, despite close matching of the flow duration curves (Kingston and Taylor, 2010). Even in the context of possible errors in the observed discharge data of +/- 15% (Mileham et al., 2008), the errors produced were large, showing that some uncertainty pertaining to model calibration will always remain.

Uncertainty in the parameters of the hydrological model (i.e. model parameterisation) is a possible cause for additional uncertainty in climate change projections of freshwater. However, Kingston and Taylor (2010) undertook an uncertainty analysis through manually varying the 10 most sensitive parameters, including evapotranspiration and soil water capacity, in their hydrological model for the Mitano Basin. This indicated that the effects of hydrological model parameter uncertainty on simulated runoff changes are small when compared to those associated with choice of GCM, climate scenario and PET algorithm, in agreement with much literature (Cisneros et al., 2014; e.g. Arnell, 2011Lawrence and Haddeland, 2011). However this was a limited and subjective assessment only performed on the HadCM3 GCM, so greater parameter uncertainty may be present for GCMs with more extreme climate scenarios.

Uncertainty in downscaling

The estimated impacts of climate change on freshwater resources can be very dependent on the approach used to downscale the climate model data, as demonstrated through systematic evaluations of different methods (Quintana Segui et al., 2010). In fact the range in projected change between downscaling approaches can be as large as the range between different climate models (Chen et al., 2011). Downscaling methods may also encompass assumptions, for example, Kingston and Taylor (2010) downscaled monthly climate data to a daily scale suing the ClimGen weather generator, which is based on the assumption that the pattern of climate change is relatively constant for a given GCM (Arnell and Osborn, 2006) – yet it is questionable if this is always the case.

Uncertainty due to lack of data

As mentioned previously with PET estimation, the projections of freshwater availability are limited by the quality of input data. In the case of Kingston and Taylor (2010), neither temperature nor evaporations data were available for the Mitano basin, so that the closest available observations were from the town of Mbarara, approximately 50 km to the East of the catchment. This would have introduced uncertainty into their models. Furthermore, the Mitano hydrological model was calibrated for the 1961-90 baseline period using daily river discharge data from only a single gauging station within the catchment – where data from more gauging stations would have been preferable (Kingston and Taylor, 2010). Lastly, in validating the hydrological model, the closest rainfall station to the Mitano River Basin in the CRU TS 3.0 data set became unavailable from 1996 onwards, with the new nearest available rainfall station located approximately 115 km from the basin – potentially being the cause of poorer performance of the validation period for the hydrological model compared to the calibration period (Kingston and Taylor, 2010).

Conclusions


This review includes the evaluation of uncertainty due to choice of GCM, estimation of PET, hydrological model structure and calibration, and limitations of the data used. The main outcome is the major dependence on the GCM used, with estimation of PET being another major source of uncertainty. Climate sensitivity is another source of uncertainty (Kingston and Taylor, 2010) which has not been explored in this post, although Cisneros et al. (2014) argue that the relative weightings given to different emissions scenarios are typically less important in determining the distribution of future impacts than the initial selection of GCMs considered. For the near future at least, uncertainty in modelling future precipitation and freshwater resources under climate change will always have some uncertainty, so climate change scenario runs should always be evaluated within the context of all this uncertainty.

Thursday 19 November 2015

Variation in the Climate Change Signal of the Discharge for the River Mitano Part 2: Different Estimations of Potential Evapotranspiration (PET) as a Source of Uncertainty

The estimation of the PET climate change signal is an important contributor to uncertainty in prediction of freshwater resources, particularly in regions where precipitation (P) is closely in balance with PET (Kingston et al., 2009), and there is a seasonal switch between P-PET deficit and surplus (Kingstonand Taylor, 2010).

Over 50 different methods of estimating PET exist (Lu etal., 2005), which each encompass different rates of change in PET for water resources. The Food and Agricultural Organisation of the United Nations (FAO) recommends use of the Penman-Monteith equation (Allen et al., 1998), however, in many locations (with certain climatological environments and where empirical calculations are robust) insufficient data prevent its use and compel application of simplified, empirical methods requiring fewer input data (Kingston et al., 2009). Priestley-Taylor is a widely used simplification of Penman-Monteith, and Hargreaves is the method recommended by the FAO in absence of sufficient data to calculate Penman-Monteith (Kingston et al., 2009). Therefore the differences between these three methods is particularly important for examining differences in projections of freshwater in practice.

Kingston et al.’s (2009) study compares the global response of 6 commonly used PET methods within hydrological models to a 2 °C rise in global mean temperature (relative to a 1961-90 baseline) under different GCMs. The results, displayed in Figure 1, show that different methods of estimating PET can produce markedly different climate change signals, and are thus an important source of uncertainty in freshwater predictions.


Figure 1. Annual PET for (a) the 1961-1990 baseline and (b-f) the assigned 2 °C climate change signal (scenario minus baseline), grouped by GCM. Ham=Hamon; Har=Hargreaves; PM=Penman Monteith; PT=Priestley-Taylor; BC=Blaney-Criddle; JH=Jensen-Haise. (Source)

Although PET increases at all latitudes for all PET methods and GCMs for the 2 °C climate scenario, differences of over 100% (> 200 mm in the tropics) exist in the climate signal between PET methods, for all GCMs (Figure 4) (Kingston et al., 2009). Maximum absolute differences occur at the same latitudes as the peak PET climate change signal (Kingston et al., 2009) – often coinciding with tropical African regions. Notably, although Priestley-Monteith, Priestley-Taylor and Hargreaves are generally closely grouped, they can still exhibit differences of over 60 mm at certain latitudes for certain GCMs (Kingston et al., 2009).

Table 1 shows that the mean range (variation) between PET methods and GCMs is higher for East Africa, where the Mitano Basin is located, than the Mediterranean and Southeast Asia. The key point here is that in each region, the choice of PET methods adds substantial uncertainty to the existing uncertainty associated with climate change signal between GCMs, and is of a comparable magnitude. Furthermore, in the case of East Africa and Southeast Asia, the choice of PET method for certain GCMs can actually determine the direction of projected changes in water surplus entirely (Kingston and Taylor, 2010).


Table 1. Statistics regarding percentage change in water surplus for three selected regions. (Source)

At the basin-scale, Kingston and Taylor (2010) compared baseline-scenario PET ratios for the three commonly used methods of calculating PET. The results are displayed in Table 2, and show that substantial differences exist in the PET climate change signal between the three methods for the HadCM3 2 °C scenario, with this difference most apparent during May, where the increase in PET ranges from 9-17% between methods (Kingston and Taylor, 2010).


Table 2. Percentage Change in monthly PET from baseline to the assigned 2 °C HadCM3 climate scenario. (Source)

This method dependence of PET estimation can be attributed to two factors. The first is the inclusion of different meteorological variables in each method (Kingston et al., 2009). For example, whilst Penman-Monteith is based on net radiation, temperature, wind-speed and vapour pressure), Priestley-Taylor is based on solely on net radiation and temperature (Priestley and Taylor, 1972). Figure 1 shows that the two methods’ signals diverge strongly at latitudes encompassing large arid or semi-arid zones (e.g. 10-30 °N), which suggests the absence of humidity data in Priestley-Taylor is critical in their differences (Kingston et al., 2009). The second factor is the different empirical formulation of each method, demonstrated through comparison of the Hamon and Blaney-Criddle signals in Figure 1; both methods are based on mean monthly temperature and day-length, yet have markedly different climate change signals (Kingston et al., 2009). The reliability of PET methods is further dependent on the reliability of input climate data – for example, compared to the relatively high confidence that can be placed in data such as observed temperature, Penman-Monteith is subject to data collection uncertainties such as the reliability of specification of canopy conductance and cloud cover (Kingston et al., 2009).


Ultimately, differences in the representation of evaporation (and snowmelt) processes lead to hydrological model structural uncertainty on projected changes, which can be substantial (e.g. Hagemannet al., 2013; Schewe et al., 2013). In some regions (e.g., high latitudes; Hagemann et al., 2013) with reductions in precipitation (Schewe et al., 2013), hydrological model uncertainty can be greater than climate model uncertainty—although this is based on small numbers of climate models (Cisneros et al., 2014). Incorporating uncertainty in hydrological model structure would have increased the range in projected impacts (Figure 3) on the Mitano Basin catchment scale even further.

Thursday 12 November 2015

Variation in the Climate Change Signal of the Discharge for the River Mitano Part 1: Choice of General Circulation Model (GCM) as a Source of Uncertainty

For the next 3 blog posts I shall be discussing uncertainty in predicting freshwater resources under climate change, and the various sources of uncertainty, with particular reference to the River Mitano in Uganda. There is a projected intensification of the global hydrological cycle over the 21st century under climate change (strong likelihood; Bates et al., 2008),  yet substantial uncertainty remains regarding the impacts of this intensification on water resources. To predict rainfall, we take evidence from a multiple GCMs, downscale them using an RCM, apply that evidence to a hydrological model which then produces multiple estimates (uncertainty) in future hydrological flows and stores. Substantial uncertainty is introduced at each stage of this process, and ultimately results in huge variations in river discharge projections. In this blog post I shall be illustrating this variation in projections of precipitation and river discharge for the Mitano River Basin in Uganda, and discussing the associated sources of uncertainty. However it is important to note that uncertainty in climate change projections of precipitation does not just affect Africa – it is a global issue.

Kingston and Taylor (2010) modelled the response of the River Mitano in Uganda to a prescribed warming of 2 °C in global mean temperature using seven GCMs. Under these 7 GCMs, the rise in annual air temperature for the Mitano catchment ranged from approximately 1.8 °C for the NCAR GCM to 2.7 °C for the MPI GCM. However, Figure 1 shows that the differences between GCMs were much greater for precipitation, with projected changes in mean annual precipitation over the basin ranging from a 23% increase (NCAR) to a 23% decrease (CSIRO). On a monthly basis, some GCMs project greater (lower) precipitation in all months whereas other project a mixture of increasing (decreasing) precipitation over the course of the year (Figure 1b). As such, uncertainty in temperature projections occur mostly from divergent warming scenarios, rather than GCMs (Cisneros et al., 2014). There is greater confidence in the prediction of temperature than there is in any prediction of rainfall in the future.


Figure 1. Graphs illustrating the differences between scenario and baseline a) temperature and b) precipitation, under the assigned 2 °C warming scenario for 7 GCMs. (Source)

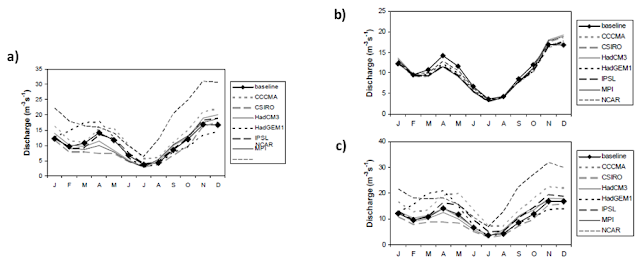
The simulated discharge for the Mitano under the 2 °C scenario shows these substantial disparities between GCMs, with little consistency in either the magnitude or direction of change on either a seasonal or annual basis (Figure 2) (Kingston and Taylor, 2010). For example, the CSIRO GCM projections result in reductions in river discharge at 2 °C that are greater than those from the HadCM3 GCM at 6 °C; whereas the NCAR GCM projections result in increased river discharge in all months that is double that of the baseline in some situations (Figure 2a) (Kingston and Taylor, 2010). In fact, the seven GCMs used here are drawn from an even larger population of 23 CMIP-3 GCMS, which, if included, would likely increase the variation in predicted discharge even further (Kingston and Taylor, 2010).


Figure 2. Climate change signal in a) monthly; b) annual discharge of the River Mitano under the assigned 2 °C warming scenario for 7 GCMs. a) (Source) (IPCC); b) (Source)

Resolution of the climate change signal for each GCM derived from temperature and precipitation separately reveals a comparative consistency in the temperature signal between GCMs (Figure 3a). In contrast, the similarity of the precipitation signal (Figure 3b) to the River Mitano’s monthly discharge signal (Figure 3c) clearly indicates that changes in precipitation are the dominant driver of changing river flow for the 2 °C scenario. Furthermore, the variation in the precipitation climate change signal between GCMs is far greater than that for the temperature signal, with different GCMs giving rise to both positive and negative changes in discharge in all months (Kingston and Taylor, 2010). Thus variability between GCMs in the precipitation climate change signal, rather than temperature, is the main source of variability between GCMs in the discharge signal for the Mitano (Kingston and Taylor, 2010). This is despite East Africa being identified as a region where there is relatively good agreement between precipitation projections (Christiansen et al., 2007). This is in agreement with several other authors, including Cisneros et al. (2014) who argue that seasonal distribution of change in streamflow varies primarily with the seasonal distribution of change in precipitation, which in turn varies between scenarios. Both the patterns of change and uncertainty are driven largely by projected changes in precipitation.


Figure 3. a) Monthly river discharge climate change signal for the Mitano; b) temperature-only climate change signal for Mitano; c) precipitation-only climate change signal. All for the River Mitano under the assigned 2 °C warming scenario for 7 GCMs. (Source)


The results of Kingston and Taylor’s (2010) modelling of future river discharge for the Mitano Basin clearly shows that the GCM used to model the effects of climate change on river discharge is a highly important source of variation (i.e. uncertainty) between projections of precipitation and thus freshwater resources. As such, single-GCM evaluations of climate change impacts on river discharge are likely to be wholly inadequate and misleading (Kington and Taylor, 2010). However, there are other important sources of uncertainty in predicting future freshwater resources, that I shall discuss further in the next posts.

Thursday 5 November 2015

Modelling Climate Change Impacts: Precipitation and Surface Water Supply

Greetings and Salutations to all the curious readers out there!

My last post attempted to describe the changes in the frequency and intensity of precipitation we’re likely to see with climate change over Africa. Leading on from that theme, I’m now going to assess the differences between two studies attempting to model and map changes in precipitation and subsequent water supply across Africa – de Wit and Stankiewicz (2006) and Faramarzi et al.,(2013). Faramarzi et al., (2013) models future climate projections (18 scenarios combined) from 5 global circulation models (GCMs) under the four IPCC emissions scenarios (IPCC, 2007) fed into an existing Soil and Water Assessment Tool (SWAT) (Arnold et al., 1998).

Precipitation

Figure 1a displays the mean expected changes in precipitation across Africa in the last quarter of the 21st century (de Wit and Stankiewicz, 2006). We can compare these expected changes in precipitation with those put forward by Faramarzi et al. (2013) (Figure 1b).

The two precipitation projections show fairly similar results for Northern Africa, with large reductions in precipitation. This means the Northern segment of the continent - with countries such as Egypt, Libya and Algeria already experiencing hyper-arid conditions - will become even more stressed due to decreases in precipitation by 25-50%, according to Faramarzi et al.,2013. Furthermore, both models project large reductions in precipitation for south-west Southern Africa (albeit by a greater amount with Faramarzi et al.’s model (2013)), and modest increases in precipitation are projected by both models for central and Western Africa.


Figure 1a and 1b. 

However, the two models disagree on the fate of East Africa; whereas de Wit and Stankiewicz (2006) predict modest increases in precipitation in the East, Faramarzi et al.’s (2013) model predicts declines in precipitation of up to 25% in Ethiopia, Somalia and Kenya in the Horn of Africa. It is possible these differences could be related to the differing time periods assessed by the two models; whereas Faramarzi et al. (2013) models the future period 2020-2040, de Wit and Stankiewicz (2006) investigate the last 25 years of the 21st century. Furthermore, the models have differing resolutions; Faramarzi et al. (2013) use the subbasin as the basic unit of assessment for projections, and as such the map goes into a higher level of detail – the de Wit and Stankiewicz model may have generalised the trends over East Africa meaning any reductions in precipitation were ignored. Despite these differences, the models predict changes in precipitation in completely different directions. This suggests that it may be down to the difficulties of, and uncertainties in, predicting precipitation in comparison to say, temperature.

Water supply

It is widely discussed in the literature that stream flow and blue water resources are sensitive to precipitation (Faramarzi et al., 2013); therefore I would expect changes in water supply to largely mirror changes in precipitation. In order to model the impacts that changes in precipitation will have on surface water supply, de Wit and Stankiewicz (2006) define 3 climatic regimes over Africa, which are separated by threshold precipitation values. All areas of Africa fall into one of these regimes. They go as follows:

·         The dry regime: Areas receiving less than 400 mm year-1 which have no perennial (long-term!) surface water drainage. This regime currently covers the largest area over Africa (41%).
·         The “unstable” intermediate regime: Areas receiving between 400 – 1000 mm year-1. Here, surface water drainage increases linearly with increasing precipitation. A change in precipitation would directly results to a change in surface water supply.
·         The ‘wet’ regime: Areas receiving over 1000 mm year-1. Here, density decreases slightly with increasing rainfall.

Figure 2a is a graph showing the effect of the predicted 10% drop in precipitation on drainage density. The unstable intermediate regime shows the most dramatic drop in surface water supply: the exponential curve means that regions on the regime’s upper boundary (i.e. receiving 1000 mm year-1) would experience a 17% reduction in drainage. On the other hand, regions on the lower end of the boundary, receiving 500 – 600 mm year-1, the same drop in precipitation would cut surface water drainage by 50 – 30% respectively. This is particularly disturbing given Figure 2b – a map of Africa divided into the three surface water regimes - which shows how 75% of African countries fall at least partly into this regime, which covers approximately 25% of the continent. Most of Southern Africa falls into either this unstable regime or the dry one, and large sections receive their sole water supply from the Orange River, which has its sources in the unstable regime.

Figure 2a and 2b.

Given the reductions in precipitation projected for Southern Africa above by both models (reductions ranging from 10-50% across both models), much of this region is likely to experience significant losses of what little drainage it does already have. This is in agreement with several studies assessed by Niang et al.,(2014), which point to future decreases in water abundance for Southern and Northern Africa. Furthermore, despite the increases in precipitation predicted for East Africa by the IPCC (although this is not in agreement with Faramarziet al., (2013)), de Wit and Stankiewicz (2006) point out how with very small amounts of rainfall to begin with (as most of it falls within the dry or unstable regime), this may not significantly increase its surface water drainage density.

We can compare these predicted changes in surface water drainage to the graphs of projected changes in blue water supply put forward by Faramarzi et al. (2013) (Figure 3a and 3b). Blue water is defined as the water yield plus the deep aquifer recharge which are renewable resources (Falkenmark and Rockstrom,2006). Figure 3a shows the blue water recorded from 1975-1995, whereas Figure 3b displays the % difference of the 2020-2039 data period from the 1975-1995 period. Note how similar Figure 3a is to de Wit and Stankiewicz’s (2006) map of surface water supply (Figure 2b) – this would suggest the data is of high reliability.


Figure 3a and 3b.

Overall, Figure 3b is surprising as it displays increases in blue water of up to 400% in the southern and northern parts of the continent. This is in stark contrast to the reductions in precipitation predicted by Figures 1a and 1b, however Faramarzi et al. (2013) note that these increases may only be construed as so large because of the small amounts of blue water availability to begin with (as shown by Figure 2b). However, as expected, countries located in the Horn of Africa and the Sahel will suffer from decreases of blue water resources with range from 25-100%.

Conclusions and Thoughts

Overall, these two studies agree that we are likely to see decreases in precipitation occurring over Northern and Southern Africa during the 21st century. Both models agree precipitation in Central Africa is likely to increase modestly, however their predictions for East Africa differ with Faramarzi et al. (2013) predicting a strong decrease in precipitation, and de Wit and Stankiwicz (2006) predicting an increase.

In terms of freshwater supply, de Wit and Stankiewicz predict a decrease in Southern and Northern Africa, whereas Faramarzi et al., (2013) project strong increases. The two models do however agree on likely decreases in East Africa.

It’s important to reflect on the fact that there is a growing body of literature arguing climate change in Africa will have an overall modest effect on future water scarcity relative to other drivers, such as population growth, agricultural growth and land use change (Niang et al., 2014). These studies could be criticised in that they do not consider any such changes land use changes, or the associated changes in soil parameters such as increases in soil erosion through deforestation. This in turn can affect partitioning of rainfall into runoff and infiltration (Faramarzi et al., 2013). Lastly, inadequate observational data throughout Africa remains a systematic limitation for estimating future freshwater availability (Niang et al., 2014).